
How long have you wished for customizable tables in Qlik Sense?
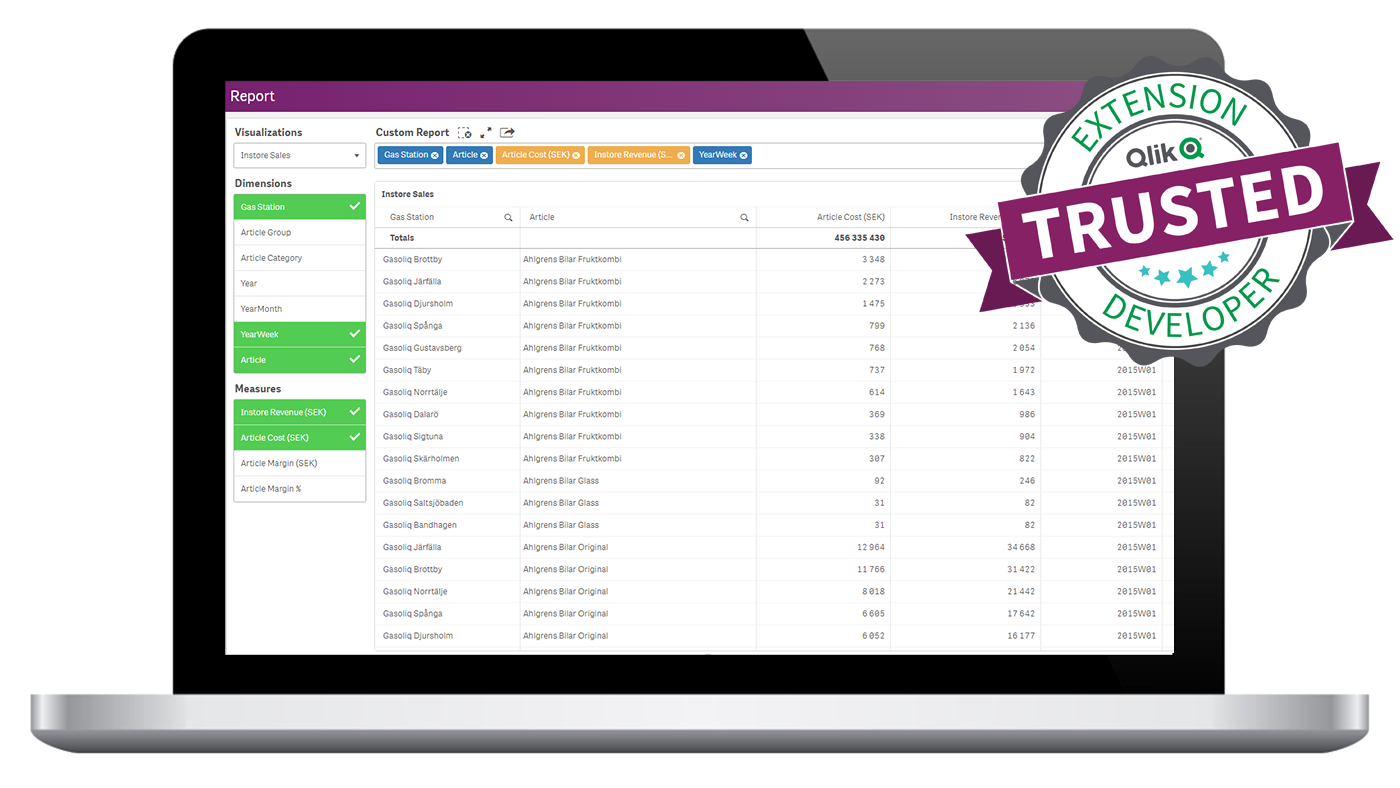
The TED accredited Vizlib Custom Report Extension for Qlik Sense is the quintessence of self-service, being able to create customized tables based on data in master tables gives you an extremely versatile and powerful tool. With the option to choose any dimension or measure you want to see and visualize in a variety of ways you will always have it your way. Check out the tutorial below!
WITH THE VIZLIB CUSTOM REPORT YOU CAN:
- Visualize your data as a straight table, pivot table or combo chart.
- Sort your data in pivot tables and combo charts.
- Choose between different combo chart options. You can both change layouts and add values.
- Export to an app! Export your customized table. Just select the data, click “export to app” and continue working with your new data set.
This is how it works.
Check out the tutorial!
NEW FEATURES IN THE CUSTOM REPORT VERSION 2.4
- Defer Layout Update – Wait for confirmation before updating the visualization.
- Show details – Use descriptions in your master item dimensions and measures.
- Icons – Option to use icons instead of a drop-down menu.
- Hide-options – Hide items on the context.
- Combo Chart options – Show/Hide data labels and data points.
- Sort dimensions/measures – Now available in pivot tables and combo charts too.
CHANGES AND BUG FIXES
- Totals is on as default if not otherwise specified.
- Reorganized the settings in the property panel.
- Perfect scrollbar bug.
- Export to app.
- Selection errors on large datasets.
- Column order sync error.
- Improved Firefox compatibility.

What are Vizlib Extensions?
Vizlib is your shortcut to greater functionality! With Vizlib’s value-added extension products, you can add smart, customised functions and visualisations making Qlik Sense even more powerful, multifaceted and easier to use. In other words, make up a complete business solution in Qlik Sense. Instead of spending time building and supporting, your focus can be getting more from your data. These products are easy to use, get started at once – a plug and play solution, fully supported with new versions of Qlik Sense. Using QlikView today? Value-added extension products are the way to a better BI solution in Qlik Sense, using the functionality you know and appreciate from QlikView.
AVAILABLE BY SUBSCRIPTION
Vizlib Extensions are available by monthly subscription and fees are based on the number of users in Qlik Sense. The extensions can be used on all applications and by all users. The subscription normal product support, updates and any additions made to the packages over time.
Want to know more?
Contact us!
Jonas Grundström
Sales & Business Development Director
jonas.grundstrom@climber.se
+46 73 340 26 36
Daniel Häggroth
BI Manager
daniel.haggroth@climber.se
+46 73 537 10 26
News

What’s New in Qlik Cloud – July 2026
Alongside the regular round-up of analytics and data integration updates, June saw one of the most significant announcements in Qlik Cloud’s roadmap to date: the general availability of agentic data engineering capabilities across the entire platform.
>> Read more
Qlik a Leader in the 2026 Gartner Magic Quadrant for Analytics and Business Intelligence Platforms
Get your free copy for an overview of the entire Analytics and Business Intelligence landscape and see why Gartner has recognised Qlik as a Leader in the Magic Quadrant for the 16th consecutive year.
>> Download the report
Fabric Apps Change How Organisations Build Data-Driven Applications
With the introduction of Fabric Apps, Microsoft Fabric is no longer just becoming a place to analyse data. It is becoming a platform for building complete business applications.
>> Read more